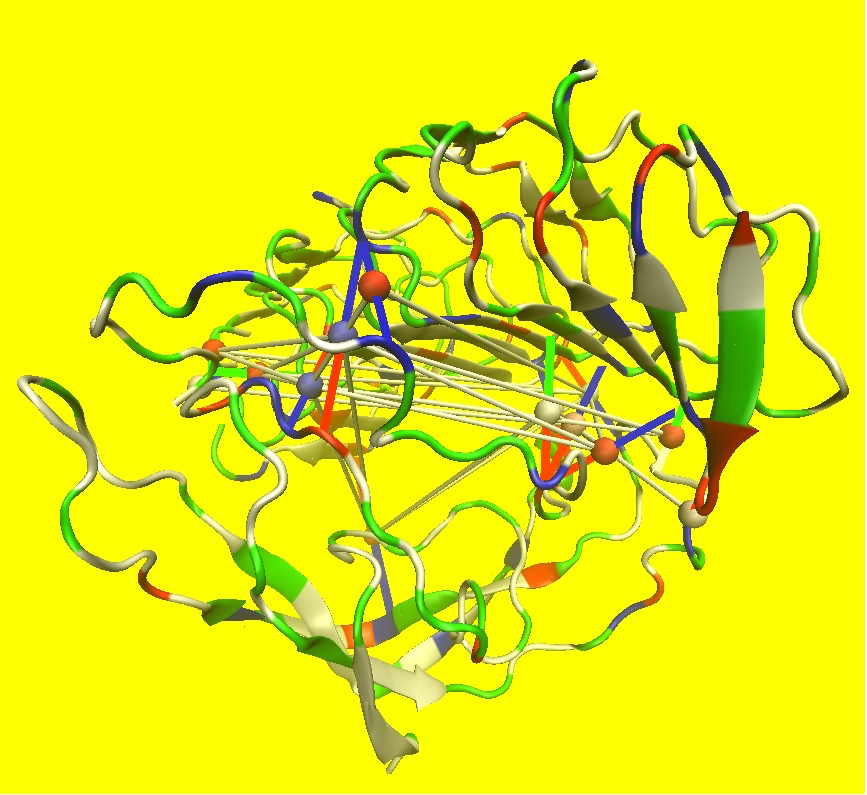
Visualization of hydrogen bonds between two proteins from a MD simulation. Lines with a sphere in the middle are drawn between the Calpha atoms of each pair of residues that were hydrogen bonded more than 6% of the time. The protein cartoon is color coded by the residue types (red: -; blue: +; green: polar; white: hydrophobic) and the lines between the Calpha atoms share the color code of the residues connected. The spheres are color coded by the fraction of time they were formed (0 - 1) : (red - green - blue). White rods were drawn between the spheres of bond pairs that were anti-correlated (correlation coefficient < 0.25).