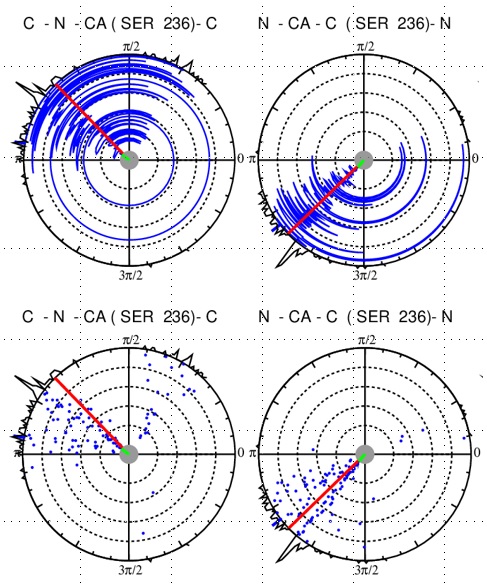
The evolution of a selected residue's Psi ans Phi angle represented as dial plots. The radius is the time axis. The line in the central disk gives the initial value, the red line the average value and the green tick outside the disc shows the final value. The angle distribution is mapped outside the dials. Optionally, the connecting arcs can be omitted.