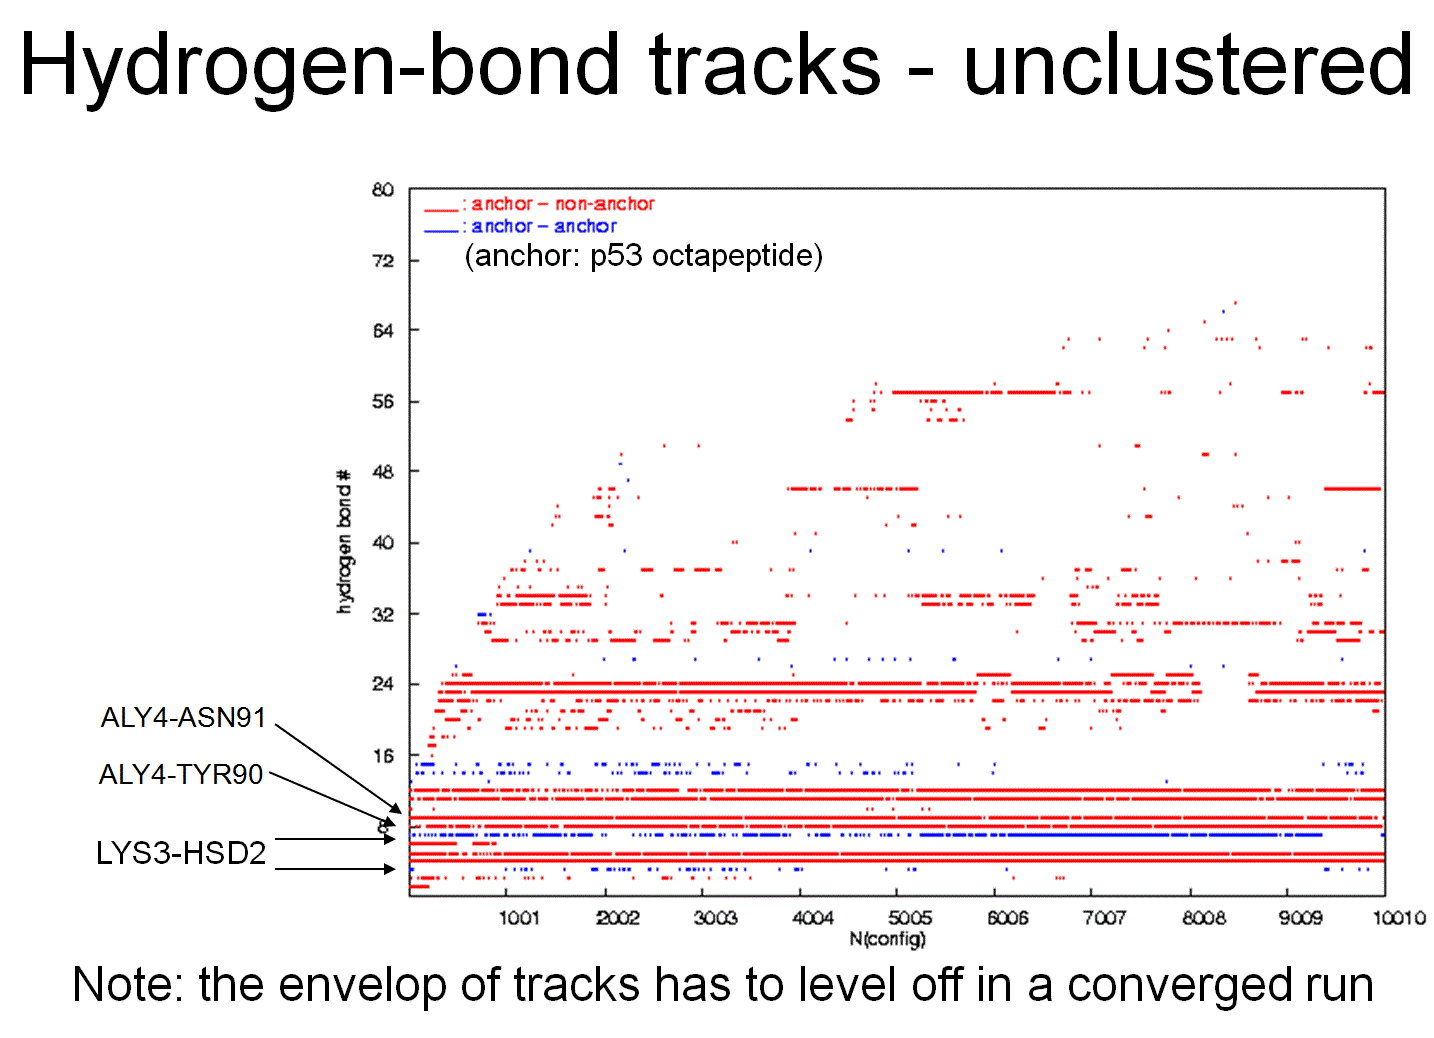
Plot of the time evolution of hydrogen bonds in a ligand-protein complex. Each line represents a particular hydrogen bond. Breaks in a line represent a breakage of the hydrogen bond in that interval. Blue lines represent hydrogen bonds between ligand atoms and red lines represent bonds between the ligand an the protein.
